ITALY COVID19 MARCH 24TH 2020
March 24th, 2020.
Fabio Gori, University of Rome Tor Vergata, Rome, Italy.
I have examined the situation of the infections in Italy, as it appears from the data up to March 23rd.
The first two figures show the new and total cases of COVID19 in linear and logaritmic scales.
The linear figure shows a trend which appears close to exponential, while the logartmic one allows the hope to a slight inflection of the logartmic linear trend.

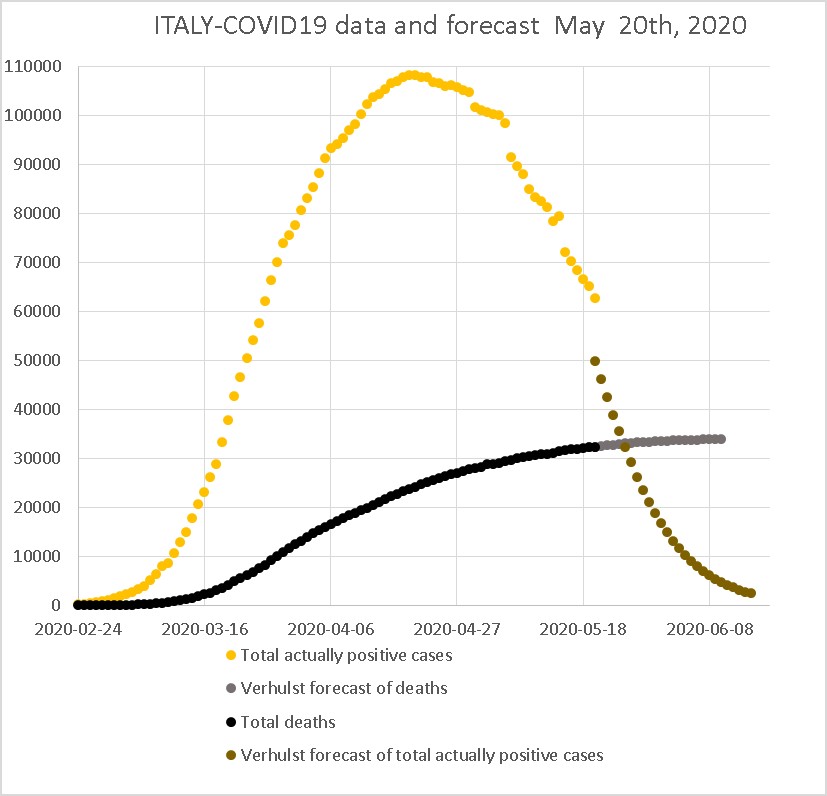
The next two figures present, besides the new cases, the total ones, the deaths and the dimissions, the forecast made with the Malthus and Verhulst equations, in linear and logaritmic scales.
According to the Verhults equation the forecast is to reach a number of around 62,000 infections by the end of March, in substantial agreement to the forecast of two days ago.


Fabio Gori, University of Rome Tor Vergata, Rome, Italy.
I have examined the situation of the infections in Italy, as it appears from the data up to March 23rd.
The first two figures show the new and total cases of COVID19 in linear and logaritmic scales.
The linear figure shows a trend which appears close to exponential, while the logartmic one allows the hope to a slight inflection of the logartmic linear trend.
The next two figures present, besides the new cases, the total ones, the deaths and the dimissions, the forecast made with the Malthus and Verhulst equations, in linear and logaritmic scales.
According to the Verhults equation the forecast is to reach a number of around 62,000 infections by the end of March, in substantial agreement to the forecast of two days ago.


Commenti
Posta un commento