Post

Visualizzazione dei post da marzo, 2020

COVID19 DATA AND FORECAST IN EU AND US, UPDATE OF MATCH 30TH, 2020.

Immagine
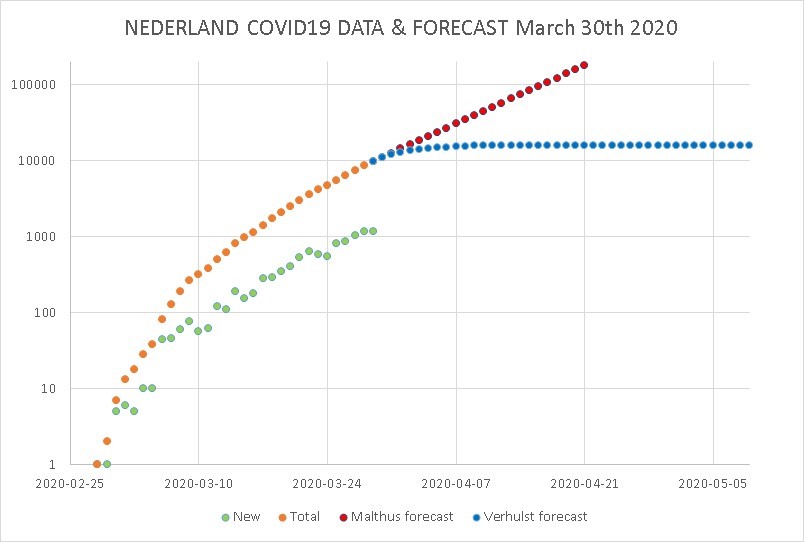
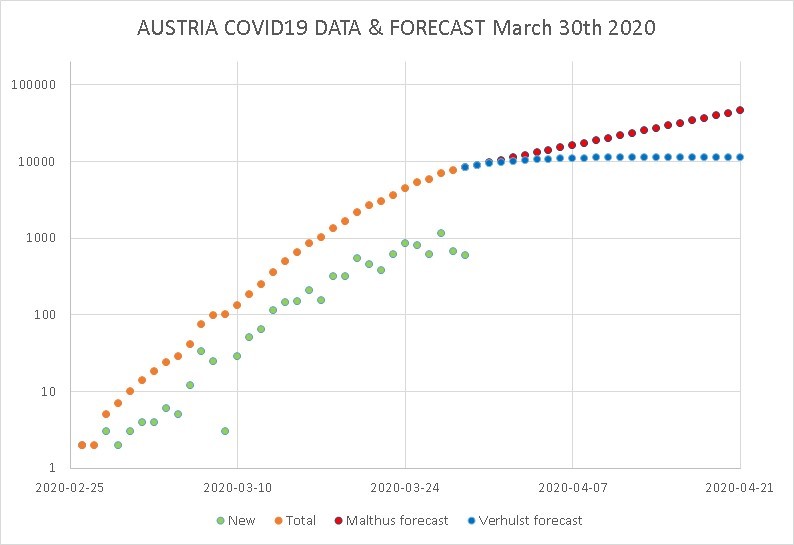
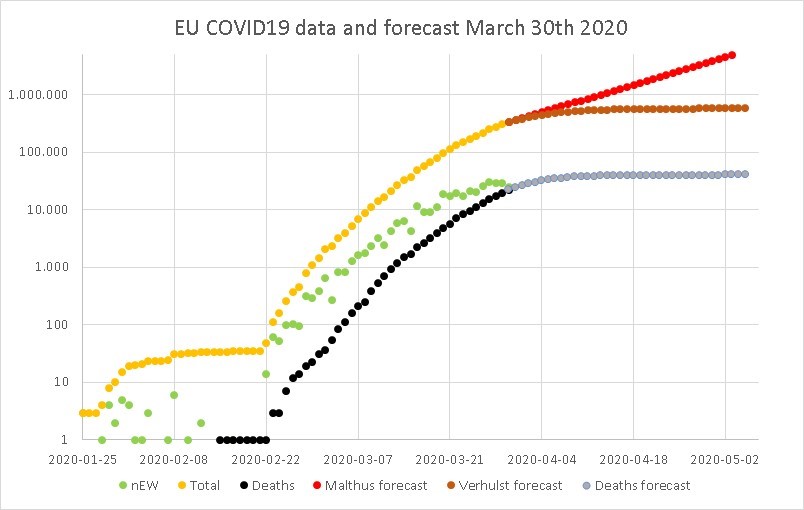
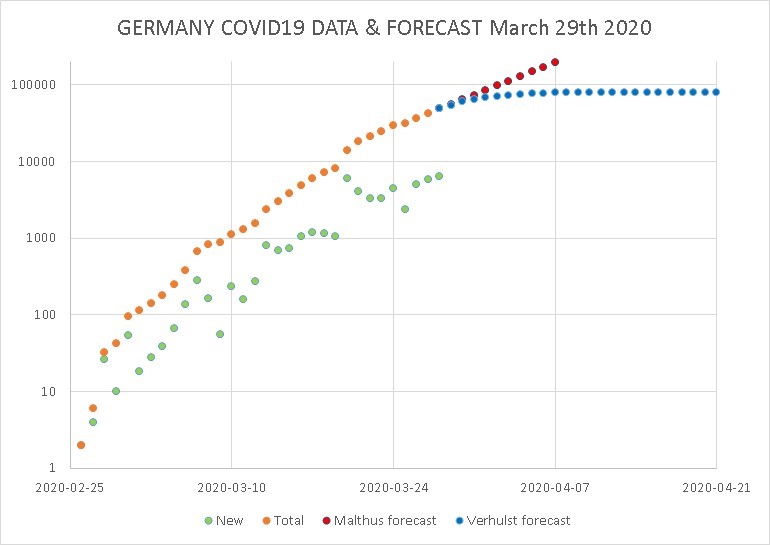
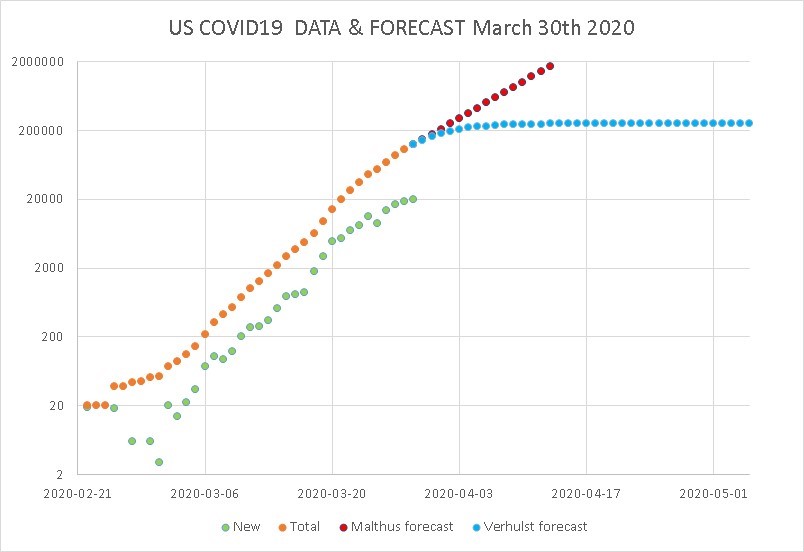
March 31st, 2020. Fabio Gori, University of Rome Tor Vergata, Rome, Italy. www.termofluidodinamica.it   forbigaio.blogspot.com covid19forecast.blogspot.com farobiogi.blogspot.com  fabiogori.blogspot.com Today I have assembled data and forecast of the COVID 19, presenting the total values of EU (with 27 countries) , of US and of the EU countries which are presenting large numbers of infections (i.e. Italy, Spain, Germany and France). Then I am presenting the data and forecast per 1000 capita of the countries which have small total numbers but high values for 1000 capita, greater or equal to 1.  The same data per 1000 capita are reported in the page of each country (in the same blog) along with the detailed description. EU with 27 countries.  United States. Italy.  Spain.  Germany. France  Austria. Belgium. Confederatio Helvetica.  Netherlands  

NETHERLANDS COVID19

Immagine
March 30th, 2020. Fabio Gori, University of Rome Tor Vergata, Rome, Italy. Today I present for the first time the data and the forecast for Netherlands.  The asymptotic value is close to 16,000. The ratio per 1000 capita is close to 1.

SWITZERLAND COVID19

Immagine
March 29th, 2020. Fabio Gori, University of Rome Tor Vergata, Rome, Italy. Today I present for the first time the data and forecast for Switzerland. The asymptotic value is above 20,000. The ratio per 1000 capita is above 2.5.

BELGIUM COVID19

Immagine
March 30th, 2020. Fabio Gori, University of Rome Tor Vergata, Rome, Italy. Today I present for the first time the data and the forecast for Belgium. The asymptotiv value is above 20,000. The ratio per 1000 capita is above 2.

AUSTRIA COVID19

Immagine
March 30th, 2020. Fabio Gori, University of Rome Tor Vergata, Rome, Italy. Today I present for the first time the data and the forecast for Austria.  The asymptotic value is above 10,000. The ratio per 1000 capita is around 1.3.

EU 27 COVID19

Immagine
 March 30th, 2020. Fabio Gori, University of Rome Tor Vergata, Rome, Italy.     The update of today, shown in the following figure, presents a forecast in the asymptotic values smaller than two days ago, since today is around 600,000, as well as the deaths forecast, around 40,000. The ratio per 1000 capita is also shown in the following. March 28th, 2020. The update of the data and predictions for the EU at 27 countries, reported in the following figure, show an increase of the asymptotic value above 750,000 cases. The data are presented also as the ratio with 1000 capita of the population. March 27th, 2020. Today I present the data and predictions for the entire European Union at 27 for the first time. The results are summarized in the following figure. The asymptotic value of the infections is 600,000. I have also evaluated the predictions for the deaths, with the asymptotic value around 58,000.

FRANCE COVID19

Immagine
March 30th, 2020. Fabio Gori, University of Rome Tor Vergata, Rome, Italy. The results are summarized in the following fiure.  The asymptotic value is above 60,000. The ratio per 1000 capita is the following, close to 1. March 27th, 2020. Today I present the data and predictions for France for the first time. The results are summarized in the following fiure. The asymptotic value is 40,000.

GERMANY COVID19

Immagine
March 30th, 2020. Fabio Gori, University of Rome Tor Vergata, Rome, Italy. The results are summarized in the following fiure.  The asymptotic value is around 70,000. The ratio per 1000 capita is close to 1. March 27th, 2020. Today I present the data and predictions for Germany for the first time. The results are summarized in the following fiure. The asymptotic value is 60,000.

US COVID19

Immagine
March 30th, 2020. Fabio Gori, University of Rome Tor Vergata, Rome, Italy. The update of today is represented by the following figure with the asymptotic value above 250,000.   Today I am presenting also the same figure per 1000 capita. The ratio is around 0.8.   March 28th, 2020. The update of today is represented by the following figure with the asymptotic value of above 200,000. It is presented also the ratio with 1000 inhabitants of the population. March 27th, 2020. The update of today is represented by the following figure with the asymptotic value of about 180,000. March 25th, 2020. Today I have studied the United States COVID19 cases with the data up to yesterday, March 24th, 2020. The first figure is relative to the new and total cases, reported in a linear scale. It is quite evident that the exponential curve of the total cases is very steep. The second figure reports the same data in a logaritmic scale where the exponential cur

SOUTH KOREA COVID19

Immagine
March 22nd, 2020. Fabio Gori, University of Rome Tor Vergata, Rome, Italy. Today I have investigated the COVID19 in South Korea. I have used the same procedure followed with the COVID19 in China posted yesterday.  First of all let's have a look to the new and total cases in South Korea until March 20th, presented in the following figure, in logaritmic scale, where the total cases until March 20th is around 8600.   Then, let's see the forecast obtained with the Malthus and Verhulst approach applied from the day reported in each of the following figures, in logaritmic and linear scale.   The conclusions are similar to the China forecast of yesterday. A sufficient number of data is necessary before to be able to forecast the total number of cases.

CHINA COVID 19

Immagine
March 21 st , 2020. Fabio Gori, University of Rome Tor Vergata, Rome, Italy. The new infections and the total ones of the COVID19 in China are examined in the following figure, in linear scale. The asymptotic value is around 80,000 cases.    T he forecast of the new infections is done by using the Malthus exponential curve and the Verhulst curve (also called S-shaped or logistic curve). The forecast are made beginning from certain days that appeared important, as February 1 st , 6 th , 11 th and 15 th , as shown from the figure in logarithmic scale, which evidences the new cases. The exam of the figure, in linear scale, indicates that a correct forecast, up to the total number of 81, 4 00 infections is possible and almost feasible when the collected data are significant and enough large. During the next days I will examine the forecast of the new cases in the other countries involved in the COVID19 pandemia.

WELCOME

Welcome letter of March 21st, 2020, first day of the Spring 2020. Dear Friend, today is the first day of the Spring 2020. In this dramatic period I have decided to spend some of my time, as a researcher, to share results of some scientific researches, devoted to forecast (or to try to forecast) what is going to happen in the near future. My thoughts are going to the people who work in these days to help the other human beings in great difficulty because of the COVID19 pandemia. I hope to have your attention and interest  Fabio Gori, University of Rome Tor Vergata, Rome, Italy.

ITALY COVID19

Immagine
March 30th, 2020. Fabio Gori, University of Rome Tor Vergata, Rome, Italy. The update of today is in the following figure. The asymptotic value is around 105,000. The following figure presents the same data per 1000 capita. The asymptotic value is around 1.7.  March 28th, 2020. The update of today is in the following figure. The asymptotic valued is above 100,000. The ratio with 1000 inhabitants is also calculated. March 27th, 2020 The update of today is in the following figure. The asymptotic valued is around 100,000.   March 25th, 2020. I have examined the situation of the infections in Italy, as it appears from the data up to March 24rd. The first two figures show the new and total cases of COVID19 in linear and logaritmic scales. The linear figure shows a trend which appears close to exponential, while the logartmic one shows a clear change of the logartmic linear trend.   The next two figures present the forecast made