US COVID19
March 30th, 2020.
Fabio Gori, University of Rome Tor Vergata, Rome, Italy.
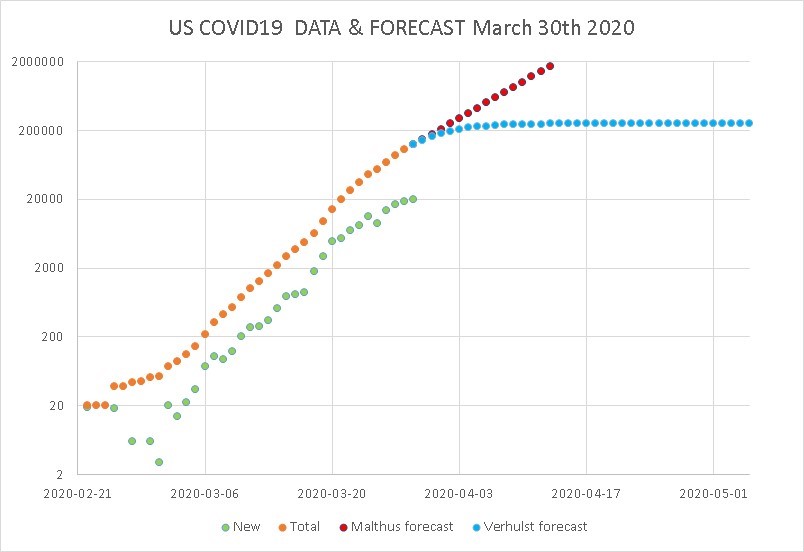
The update of today is represented by the following figure with the asymptotic value above 250,000.
Today I am presenting also the same figure per 1000 capita. The ratio is around 0.8.

March 28th, 2020.
The update of today is represented by the following figure with the asymptotic value of above 200,000.
 It is presented also the ratio with 1000 inhabitants of the population.

March 27th, 2020.
The update of today is represented by the following figure with the asymptotic value of about 180,000.

March 25th, 2020.
Today I have studied the United States COVID19 cases with the data up to yesterday, March 24th, 2020.
The first figure is relative to the new and total cases, reported in a linear scale. It is quite evident that the exponential curve of the total cases is very steep.

The second figure reports the same data in a logaritmic scale where the exponential curve become a linear increase.

In the following figure the forecasts obtained with the Malthus and Verhulst approaches are reported in a linear scale. The finale asymptotic value is above 160,000 cases.
 The same results are reported in a logaritmic scale, which evidences also the linear increase of the new cases.

In the next days I will update the forecast with the new data.
Fabio Gori, University of Rome Tor Vergata, Rome, Italy.
The update of today is represented by the following figure with the asymptotic value above 250,000.
Today I am presenting also the same figure per 1000 capita. The ratio is around 0.8.
March 28th, 2020.
The update of today is represented by the following figure with the asymptotic value of above 200,000.
March 27th, 2020.
The update of today is represented by the following figure with the asymptotic value of about 180,000.
March 25th, 2020.
Today I have studied the United States COVID19 cases with the data up to yesterday, March 24th, 2020.
The first figure is relative to the new and total cases, reported in a linear scale. It is quite evident that the exponential curve of the total cases is very steep.
The second figure reports the same data in a logaritmic scale where the exponential curve become a linear increase.
In the following figure the forecasts obtained with the Malthus and Verhulst approaches are reported in a linear scale. The finale asymptotic value is above 160,000 cases.
In the next days I will update the forecast with the new data.


Commenti
Posta un commento