COVID19 DATA AND FORECAST IN EU AND US, UPDATE OF APRIL 7th, 2020.
April 7 th, 2020.
Fabio Gori, University of Rome Tor Vergata, Rome, Italy.
www.termofluidodinamica.it
covid19forecast.blogspot.com
eucovid19.blogspot.com
usacovid19.blogspot.com
forbigaio.blogspot.com
Today I have assembled data and forecast of the April 6 th 2020 of the COVID 19, presenting the forecast of the total and new cases in Italy and EU, the total ones in USA, as well as data and forecast for 1000 capita.
Italy.
The forecast of the total cases is over 108,000 and the same data rated per 1000 capita is 1.8.
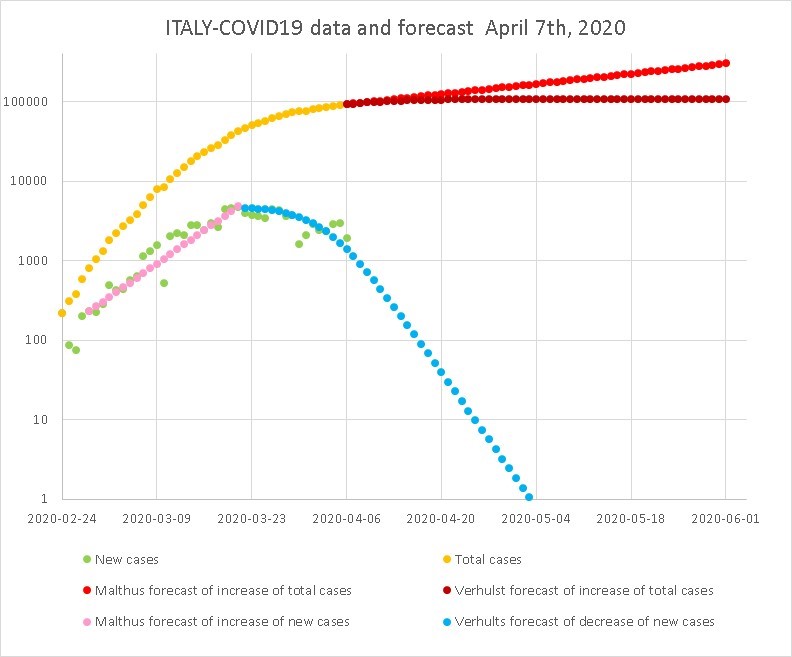
Today I present for the third day the decrease of the new cases in Italy, showing the same forecast done on April 4th, but where I have put also the new data of the 5th and 6th of April.
As is shown by the figure the forecast seems to be still valid since the real data presents oscillations around the Verhulst forecast, which is a mean one.

EU.
The forecast of the total infections is somewhat above 700,000, while the same data, rated per 1000 capita, is 1.6.


Today, for the first time, I have done and reported the Verhulst forecast of the new cases.
The forecast depends on the initial day, due to the day by day variation of the data.
The forecast starting from March 10th brings to a forecast of 25,000 new cases .
The forecast starting from March 13th to a forecast of 42,000.
As is shown from the following figure the two values are completely compatible with the day by day variation of the new cases.


USA.
The forecast of the total cases is over 450,000, while the same data, rated per 1000 capita, is over 1.4.


Fabio Gori, University of Rome Tor Vergata, Rome, Italy.
www.termofluidodinamica.it
covid19forecast.blogspot.com
eucovid19.blogspot.com
usacovid19.blogspot.com
forbigaio.blogspot.com
Today I have assembled data and forecast of the April 6 th 2020 of the COVID 19, presenting the forecast of the total and new cases in Italy and EU, the total ones in USA, as well as data and forecast for 1000 capita.
Italy.
The forecast of the total cases is over 108,000 and the same data rated per 1000 capita is 1.8.
Today I present for the third day the decrease of the new cases in Italy, showing the same forecast done on April 4th, but where I have put also the new data of the 5th and 6th of April.
As is shown by the figure the forecast seems to be still valid since the real data presents oscillations around the Verhulst forecast, which is a mean one.
EU.
The forecast of the total infections is somewhat above 700,000, while the same data, rated per 1000 capita, is 1.6.
Today, for the first time, I have done and reported the Verhulst forecast of the new cases.
The forecast depends on the initial day, due to the day by day variation of the data.
The forecast starting from March 10th brings to a forecast of 25,000 new cases .
The forecast starting from March 13th to a forecast of 42,000.
As is shown from the following figure the two values are completely compatible with the day by day variation of the new cases.
USA.
The forecast of the total cases is over 450,000, while the same data, rated per 1000 capita, is over 1.4.


Ottime previsioni 🤗
RispondiElimina